Performance Data Recorder: The Ultimate Guide to Getting Faster on Track
My first track day at Brands Hatch, I was 2.1 seconds off the pace. I felt fast, but the stopwatch doesn’t lie. My lines looked okay, and I was braking as late as I dared. Yet, lap after lap, the timer told the same story.
It wasn’t until I reviewed my first video data file that I saw the truth. The data showed me, clear as day, that I was braking too early for Paddock Hill Bend and not committing to 100% throttle on the back straight.
For UK track day enthusiasts and amateur racers, a Performance Data Recorder (PDR), or Video Data Logger (VDL) as they’re often called—is the single most powerful tool for improvement. It’s an honest co-driver that shows you exactly where you’re losing time.
This is not just another article about product features. This is a complete guide to understanding what a PDR is, how it differs from a simple dashcam, and most importantly, how to use the data to become a faster, more consistent driver.
What is a Performance Data Recorder? (And What Isn’t It?)
First, let’s clear up the confusion. The term PDR is often muddled with two other devices: a standard dashcam and an EDR.
More Than Just a “Track Day Dashcam”
A dashcam is a simple video camera. It’s great for insurance, but for performance, it’s useless. It only records what happens.
A Performance Data Recorder is an integrated system that combines high-definition video with professional-grade telemetry data. It doesn’t just show you driving around the track; it records how you were driving. It synchronises your every action—your speed, G-forces, and track position, with the video, frame by frame.
PDR vs. EDR: The Critical Difference Every UK Driver Should Know
This is the most important distinction to understand, and it’s a content gap we see all the time.
- A Performance Data Recorder (PDR) is a voluntary, driver-focused tool you install for performance improvement. Its purpose is to help you get faster. The data is stored on a removable SD card for your personal analysis.
- An Event Data Recorder (EDR) is a factory-installed “black box” inside your car, often part of the airbag control module. Its purpose is crash analysis.
Official sources like the National Highway Traffic Safety Administration (NHTSA) define an EDR’s purpose as recording a few seconds of data (like speed, brake input, and seatbelt status) before, during, and after an airbag deployment.
You use a PDR. An insurer or investigator uses an EDR.
Here’s a simple breakdown:
| Feature | Performance Data Recorder (PDR) | Event Data Recorder (EDR) |
| Primary Purpose | Driver improvement & performance analysis | Accident investigation & crash analysis |
| Who Uses It? | The driver (you) | Vehicle manufacturers, investigators |
| Data Recorded | HD video, high-speed GPS, G-force, lap times, CAN data | Vehicle speed, brake/throttle, steering, airbag status |
| When Does It Record? | When you turn it on (at the track) | Automatically, for a few seconds around a crash event |
| Data Access | Easy (removable SD card) | Difficult (requires special tools) |
How a Performance Data Recorder Works: The 4 Core Components
A PDR is a system of sensors working together. Understanding these components helps you understand the data you’ll be analysing.
1. High-Refresh Rate GPS (10Hz vs. 25Hz)
Your phone’s GPS is useless for the track. It probably runs at 1Hz, meaning it samples your position once per second. At 100 mph, you travel over 44 metres in that second. On a data map, a 1Hz GPS will show you cutting corners and driving in jagged straight lines.
A true Performance Data Recorder uses a high-refresh-rate GPS:
- 10Hz GPS: Samples your position 10 times per second. This is the minimum for serious track use and is found in popular units like the AiM Solo 2.
- 25Hz GPS: Samples 25 times per second. This is the professional standard, found in top-tier Racelogic VBOX (Source 1) systems. It provides an ultra-smooth, incredibly accurate track map and speed signal.
Pro-Tip: Your phone’s GPS is fine for M25 traffic, but it will show you driving through the chicane at Silverstone. Don’t rely on it. For accurate racing lines and braking points, you need a logger with a minimum 10Hz GPS refresh rate.
2. The Accelerometer (Your Built-in “G-Force” Meter)
This is a sensor that measures G-force. It’s the key to understanding car balance and grip.
- Longitudinal Gs: Acceleration (positive G) and Braking (negative G).
- Lateral Gs: Cornering (left/right G).
This data is used to create the “Friction Circle” graph, which is the single best visualisation of your car control and how much grip you’re using at any given moment.
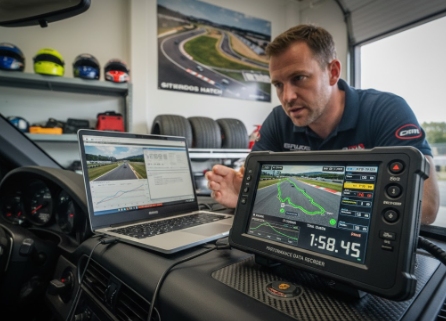
3. HD Video with Real-Time Data Overlay
This is what connects the numbers to reality. The PDR’s “brain” takes all the data from the GPS and accelerometer and stamps it directly onto the video file.
When you watch your lap back, you don’t just see the track. You see a real-time overlay of your speed, lap time, G-forces, and a live track map. You can see exactly what the car was doing at that specific moment.
4. CAN Bus / ECU Integration (The Game-Changer)
This is the jargon-buster, and it’s the feature that separates serious tools from toys.
CAN bus is your car’s internal data network. It’s how your engine’s brain (ECU) talks to your dashboard and other modules. A powerful Performance Data Recorder can “listen” to this network, either by plugging into your OBD2 port or by being wired in directly.
Why does this matter? Because you can record your inputs as a driver.
- Precise Throttle Position (TPS): Are you really at 100% throttle? Or are you hesitating and only at 90%? The data knows.
- Brake Pressure: How hard are you braking? Are you smoothly “trail-braking” into the corner, or jabbing the pedal and unsettling the car?
- Steering Angle: How smooth are your steering inputs? Are you sawing at the wheel?
This is the most valuable data. You can see what you were doing to cause the car to behave a certain way. Manufacturers like AiM Sportline (Source 2) are renowned for their deep ECU integration, providing thousands of profiles for different cars.
Finding the Right Performance Data System: A “Crawl, Walk, Run” Guide
You don’t need to spend £2,000 to get started. Your data-logging journey can grow with your skill.
CRAWL: Smartphone Apps + External GPS (Under £200)
- Who it’s for: The brand-new track day driver.
- The Setup: Your own smartphone running an app (like RaceChrono or Harry’s LapTimer) paired via Bluetooth to an external 10Hz GPS receiver (like a Garmin GLO 2 or Qstarz).
- Pros: Very low cost, great for learning the basics of lap timing and speed traces.
- Cons: Drains your phone battery, no video integration (you have to sync a separate GoPro file manually), and no CAN bus data.
WALK: All-in-One GPS + Video Loggers (The Sweet Spot: £700 – £1,800)
- Who it’s for: The serious enthusiast who wants to analyse data and video together seamlessly.
- The Setup: A dedicated, all-in-one unit. This is the most popular category.
- Key UK Players:
- Racelogic VBOX Video HD2: The industry standard for a reason. It has two cameras, an incredible 25Hz GPS, and its “Circuit Tools” analysis software is brilliant, powerful, and easy to use.
- AiM Solo 2 DL + SmartyCam: This is the data-integration king. The Solo 2 DL is a GPS lap timer and data logger that connects to your ECU (CAN/OBD2). It then sends that data to the separate SmartyCam, which records the video and overlays the data automatically.
RUN: Modular, Multi-Sensor Professional Systems (£2,500+)
- Who it’s for: The amateur racer, a data fanatic, or someone building a dedicated track car.
- The Setup: Modular loggers like the AiM MXP or MXG digital dashes. These are fully wired into the car’s electronics.
- Pros: The most data possible. You can add sensors for individual wheel speeds, brake temperatures, suspension travel, and more.
- Cons: Very expensive and requires professional installation.
How to Actually Find Lap Time: A 3-Step Analysis Guide
You’ve got your footage from your new Performance Data Recorder. Now what?
Don’t just watch the video. You need to analyse the data. Open your software (like VBOX Circuit Tools or AiM Race Studio) and start here. This is how you find real time.
Step 1: Compare Your Fastest Lap vs. Your “Ideal” Lap
Your software will automatically create an “Ideal Lap” (or “Reference Lap”). It does this by taking your best-ever time from each sector of the track and stitching them together into one “perfect” lap.
Your first job is to look at the “Time Delta” (or “Time Slip”) graph. This graph compares your fastest lap to your ideal lap.
- When the line is flat, your speed is matching your best.
- When the line goes down, you are gaining time (going faster than your best).
- When the line goes up, you are losing time.
Find the biggest part of the track where the line goes up. That’s your biggest opportunity. Now, let’s find out why.
Step 2: Analyse Your Braking Points (The Speed Trace)
Pull up the Speed graph (or “speed trace”) for your fastest lap and your ideal reference lap. You are looking for two things:
- Braking Point: Look at the start of the braking zone (where the speed line starts to drop). Are you braking earlier than your best lap?
- Minimum Speed: Look at the “V-min” (your minimum speed at the apex of the corner). Is it slower? A tiny 1mph difference in minimum speed at the apex can easily mean a 5mph difference by the end of the next straight.
Common Mistake: New drivers obsess over late braking. Pros focus on a higher minimum apex speed and getting on the throttle earlier. The goal isn’t to brake the latest; it’s to get through the corner and onto the next straight fastest. The speed trace shows this perfectly.
Step 3: Analyse Your Throttle & Brake Inputs (The CAN Data)
This is where your CAN bus data pays off. If you have throttle and brake data, this is your gold mine.
- Throttle: Pull up your Throttle Position (TPS) graph. Are you at 100% on every straight? How quickly do you go from 0% (coasting) to 100% (full power) at the apex? The data will show any hesitation you feel but can’t prove.
- Brakes: Look at the brake pressure graph. Are you “trailing” the brake smoothly into the corner to keep the car’s nose planted (good)? Or are you jabbing it and unsettling the car (bad)?
This is the exact data professional driver coaches (Source 4) use to refine technique. You’re no longer guessing; you’re seeing your inputs and their consequences.
The Honest Co-Driver
A Performance Data Recorder is far more than a simple dashcam; it’s a powerful telemetry system. It’s the bridge between feeling fast and being fast.
Understanding the data from its high-refresh GPS, accelerometer, and CAN bus integration is the key to unlocking consistent performance. The data never lies. It removes the guesswork, the ego, and the “I felt fast” from the equation.
It’s the most honest, effective driver coach you can buy.
Ready to stop guessing and start improving? Explore our in-depth reviews of the latest video data loggers and find the perfect system for your next track day.
FAQs
What is the difference between a PDR and an EDR?
A PDR (Performance Data Recorder) is a tool you add to your car to record video and performance data (like GPS, G-force) to help you get faster on a track. An EDR (Event Data Recorder) is your car’s factory-installed “black box” that only records a few seconds of data during a crash for accident analysis.
Is a Performance Data Recorder the same as a dashcam?
No. A dashcam only records video. A Performance Data Recorder records video plus synchronised telemetry data, such as your 10Hz/25Hz GPS position, speed, G-force, and lap times, all overlaid on the video for analysis.
What does a PDR record?
A PDR records high-definition video with a real-time data overlay. This data includes your precise GPS location, speed, longitudinal (braking/acceleration) and lateral (cornering) G-force, and lap times. If connected to the CAN bus, it also records driver inputs like throttle position, brake pressure, and steering angle.
What is the PDR on a Corvette or GM vehicle?
The GM PDR, developed with Cosworth, was one of the first factory-integrated Performance Data Recorders. It uses a built-in camera, GPS, and the car’s CAN bus data to record video with a full telemetry overlay. This data can be analysed in the “Cosworth Toolbox” software.
How do you use a performance data recorder?
You record your driving session at the track. Afterwards, you take the SD card to your computer and load the file into analysis software (like VBOX Circuit Tools or AiM Race Studio). You use this software to compare your laps, analyse your speed trace, check your braking points, and see where you’re losing time.
What is the best GPS lap timer for track days?
For many UK enthusiasts, the “best” GPS lap timer is either the AiM Solo 2 DL (known for its powerful ECU/CAN data integration) or a Racelogic VBOX system (known for its industry-leading 25Hz GPS accuracy and excellent “Circuit Tools” analysis software).
What is CAN bus on a data logger?
CAN bus is your car’s internal computer network. A data logger with CAN bus capability can “listen” to this network (via the OBD2 port or direct wiring) to record valuable data straight from your car’s sensors, such as exact throttle percentage, brake pressure, and steering wheel angle.
Can I use my phone as a data logger?
You can, but it’s limited. A phone’s internal GPS is 1Hz (1 sample per second), which is too slow for accurate track analysis. For a good entry-level setup, you must pair your phone (running an app like RaceChrono) with an external 10Hz GPS receiver via Bluetooth.